Published On Jan 8, 2024
In today’s tutorial from Pharos Technology, we're diving into the versatile world of conditional formatting in Microsoft Excel. This powerful tool can transform how you visualize and interpret data in your spreadsheets, making it an essential skill for any Excel user.
Understanding Conditional Formatting:
1. Accessing Conditional Formatting: Located on the Home tab, the Conditional Formatting button opens up a range of options for dynamically formatting your spreadsheet based on specific criteria.
2. Highlight Cell Rules: This option lets you set conditions for individual cells, such as highlighting cells that exceed a certain value, fall within a range, or match a specific text string.
3. Top/Bottom Rules: Ideal for identifying top performers or values below a certain percentile, these rules help in quickly assessing data extremes.
4. Data Bars: These graphical bars within cells visually represent data values, giving an immediate sense of comparison across cells.
5. Color Scales: Use color gradients to differentiate data, making it easier to spot high and low values at a glance.
6. Icon Sets: These add visual icons (like arrows or checkmarks) based on data value ranges, offering an instant visual cue.
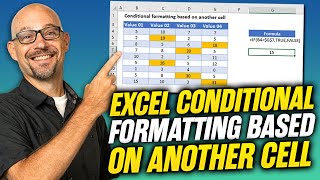
7. Formula-Based Rules: Perhaps the most powerful, this allows you to apply formatting based on a custom formula, offering limitless possibilities.
Practical Applications of Conditional Formatting:
1. Data Bars Example: Visualize song lengths in an album or monthly call volumes in a customer service report.
2. Color Scales Example: Quickly assess sales performance across different regions or months.
3. Icon Sets Example: Instantly see project status updates or financial performance indicators.
4. Formula-Based Rules: Highlight specific days (like Mondays) in a content calendar or deadlines in a project timeline.
Conditional formatting in Excel is not just about making spreadsheets look aesthetically pleasing; it’s about making data analysis more intuitive, efficient, and insightful. Whether you’re managing large datasets or need a quick way to assess key metrics, mastering conditional formatting is key to unlocking Excel's full potential.
Keywords: Conditional Formatting, Excel Tutorial, Data Visualization, Microsoft Excel, Spreadsheet Analysis, Dynamic Formatting, Data Representation
See my other channels:
Current news on the economy and economic concepts:
/ @doctorecon
Current thoughts on leadership topics:
/ @pharosleadership
Blockchain and Cryptocurrency News:
/ @pharosblockchain