Published On Jan 18, 2023
It's almost a given that we take Estimates, mix them up in a certain way, and produce a Forecast. But what if we could Forecast WITHOUT Estimating?
= = = = = = = = = = = =
New for 2024: my best-ever training:
"How Your Agile Teams Can Achieve Predictability and Productivity WITHOUT Burnout"
→ https://www.developmentthatpays.com/w...
= = = = = = = = = = = =
Grab your FREE Agile Forecasting Cheat Sheet: https://pages.developmentthatpays.com...
Learn more about Vasco Duarte and #NoEstimates: https://www.youtube.com/results?searc...
0:00 Intro
0:30 Catch up with the series
0:44 Story Points Forecast method 1
3:34 Story Points Forecast method 2
5:50 Story Points Forecast method 2½
6:23 The fundamental flaw
7:03 Vasco Duarte and #NoEstimates
9:11 Story Points data
9:40 NoEstimates data
10:08 NoEstimates Forecast method 1
10:52 NoEstimates Forecast method 2
11:31 NoEstimates Forecast method 2½
12:02 The big reveal
-------------------
152. Agile Forecasting... WITHOUT estimates?
#AgileForecasting #NoEstimates #DevelopmentThatPays
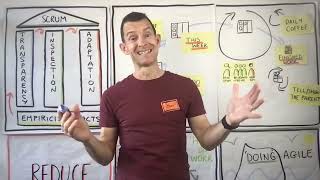
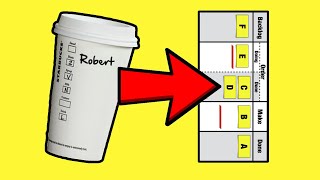
If you thought it was necessary to estimate in order to forecast, well, you are not alone. It's almost taken for granted here in our Agile world, that we start with estimates, mix them up in a certain way, and produce a forecast. It's just what we do. But what if we could forecast without estimating Welcome to Development That Pays, my name is Gary Straughan, and welcome back to this short series on estimates and estimating. If you've been following along, you already know that I prefer you didn't estimate, but if we don't estimate, how on earth can we forecast, how indeed We'll get to that in due course, but let's start with common practice. Common practice is to forecast via velocity. Velocity, as I'm sure you know, is the average number of Story Points delivered per sprint. Now, already you can tell I'm talking about Scrum. However, although some of the terms I'm gonna be using are Scrum specific, the general approach is not. I'll say more about that in a moment. As I was saying, velocity is the total number of Story Points delivered per sprint, meaning that if we can figure out the total number of Story Points in what it is that we need to build, then we can figure out how many sprints it's going to take. For example, if we have 1000 Story Points in total, and a velocity of 100 Story Points for sprint, divide one by the other, we're looking at 10 sprints. If we're doing two week sprints, that's 20 weeks. So far, so simple. I guess the only tricky bit is coming up with a value for velocity, and the way I was taught to do that is by plotting a graph. Sprints along the bottom, Story Points on the side, and I'm gonna plot the total number of stories delivered in each sprint. The next job is to come up with a line of best fit, and there are a couple of things to bear in mind while doing so. Firstly, what we're looking for, especially in the context of forecasting, is stability. That's something we're unlikely to get with a brand new team, or a team that's had major personnel changes. It's usually gonna take a few sprints for things to settle down a bit, and for that reason, I'm gonna ignore the first three sprints. Secondly, what we're looking for here is a horizontal line, this would be velocity decreasing over time, luckily, that's relatively rare, this is velocity increasing over time, despite what we'd wish for, this is extremely rare. So yes, a horizontal line, and I'm gonna fix it right around here. Looks like our velocity is, well, would you believe it 100 Story Points per sprint. You know I like my nice round numbers. And now we have a value for velocity, we're ready to make a forecast. Let's say we have 1000 Story Points in the backlog, divide one number by the other, that's a forecast of 10 sprints, or 20 weeks if we're doing two week sprints. As I said earlier, some of the terms here might be Scrum specific, but the approach is not. What we're plotting here is the number of Story Points delivered in each sprint, but we could just as easily plot Story Points delivered each week. So if you're not doing Scrum, but you are estimating, you could use this approach, and the same goes for the approach I'm about to show you. But just because you could, doesn't mean you should. I'll say more about that later. There's another way of forecasting that we can do right on the graph, no arithmetic required. This axis doesn't change, still sprints, or weeks if you're not doing Scrum, but I'm gonna change this one from Story Points to cumulative Story Points. Exactly the same data, just presented in a s
• Agile Forecasting... WITHOUT estimates?