
Published On Jul 21, 2021
You’ll learn ALL about the 7 QC Tools while we work an example to demonstrate how you might use these tools in the real world.
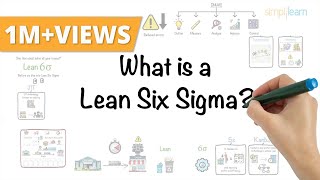
These include the Flow Chart, Check Sheet, Pareto Chart, Fishbone Diagram, Scatter Diagram, Histogram and the Control Charts
00:51 - Intro to the 7 QC Tools
1:33 – Flow Charts
3:59 – Check Sheets
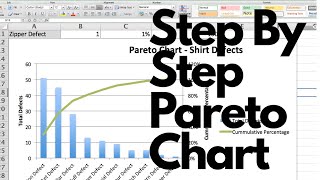
5:32 – Pareto Charts
7:21 – The Cause-and-Effect Diagram (Fishbone Diagram)
10:19 – The Scatter Diagram (XY Scatter Plot)
12:36 – The Histogram
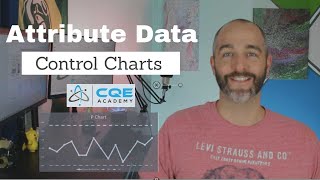
14:03 – The Control Chart
Free Resource!!!:
https://cqeacademy.com/FreePracticeExams
https://cqeacademy.com/FreeCheatSheet
https://cqeacademy.com/freeplan
https://cqeacademy.com/freecourse
https://cqeacademy.com/course
• CONTROL CHART BASICS and the X-BAR AN...
• Attribute Data Control Chart Examples...