Published On Sep 2, 2020
In this video we are going to address a complex form of simulation, a form that you might find very applicable in the real world. This one involves what goes into a very important feature of business, the bottom line.
Want to know what a Monte Carlo Simulation is? and how to use Monte Carlo Simulation technique for a profitable business ? In this video I have performed Monte Carlo Simulation in Excel.
What is a Monte Carlo Simulation?
Monte Carlo simulations are used to model the probability of different outcomes in a process that cannot easily be predicted due to the intervention of random variables. It is a technique used to understand the impact of risk and uncertainty in prediction and forecasting models.
Monte Carlo simulation can be used to tackle a range of problems in virtually every field such as finance, engineering, supply chain, and science.
Monte Carlo simulation is also referred to as multiple probability simulation.
Excel is a wonderfully flexible and powerful tool. For example, you can create models that let you modify your formula's inputs to estimate sales revenue and costs. You can also model systems that use random events such as product demand to estimate resource utilization and other costs.
Now before we get into today’s video where I will show you how to setup an excel model which can help you run an effective Monte Carlo Simulation to optimize your organizations supply chain and can help you with financial decision making.
Let’s discuss what a Monte Carlo Simulation actually is?
Monte Carlo simulation is a method of probability analysis done by running several variables through a model to determine the different outcomes
By using Monte Carlo simulations decision makers can determine the range of possibilities and their probability of occurrence. A Monte Carlo simulation works by constructing a mathematical model of the decision under consideration. Then the simulation is run, and different random variables are put into these models until there are enough outcomes to plot on a probability distribution curve. Based on the shape of curve created by the Monte Carlo simulation, decision makers will know where their ultimate decision falls within the various probabilities, they then make their decision based on the risk they are willing to take to get the outcome they want.
Now, let’s get to excel where I can show you how all of this actually works.
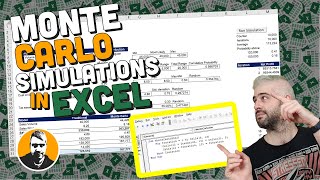
So, what you see on my screen is divided under three sections. Model Data, Probability of Item Demand & Simulation Data.
Creating an Excel simulation does involve a lot of steps, but once you get the hang of it, it's an extremely powerful tool that you'll be able to use over and over throughout your business and it's operations.
Monte Carlo Simulation in fiance is widely used for investment evaluation and can be used in several other industries and for different purposes.We're going to simulate a set of components that add up to produce a net income. We'll repeat the simulation 500 times, and we'll use an Excel tool called the data table to do it.
Monte Carlo Simulation is widely used in Finance and can be performed on various platforms like Monte Carlo Simulation in Matlab, Monte Carlo Simulation in R, Monte Carlo Simulation in Excel, Monte Carlo Simulation in Python, etc. Important thing to derive from this video is, performing Monte Carlo Simulation in Excel [Monte Carlo Simulation in excel data table is the key] can help you get probability distribution curve, which can tell you the probability of different outcomes of the scenario under consideration. This is widely used by profitable business to calculate the investment curve and profit and loss statement etc.
#MonteCarlo #Simulation #BusinessSimulation