Published On Mar 13, 2024
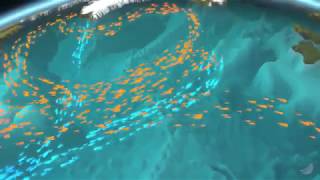
Based on a simulation with a high-resolution version of the AWI-CM3 coupled climate model, the visualization shows the sea surface temperature (color), the velocity at 30 m depth (shading) as well as the sea ice concentration (color and opacity) and sea ice thickness (height shading) for the period 2004-2011. Observed greenhouse gas concentrations have been used for the simulation.
Since the velocity at a depth of 30 m was used for the visualization instead of at the surface, the oceanic current patterns shown are much less influenced by fast-moving weather patterns and are therefore less noisy compared to velocity at the sea surface. At the same time, however, the temperature at the sea surface is also shown by color mapping, so that the effects of weather phenomena such as strong storms can still be observed. The sea ice in the Arctic and around the Antarctic has a pronounced annual cycle. Cracks can be observed particularly during the melting periods.
The simulation was carried out for the period 1900 - 2014 using the Alfred Wegener Institute AWI-CM3 climate model (https://awi-cm3-documentation.readthe...) with historical CMIP6 forcing. The resolution of the ocean model component (FESOM2) is 2-4 km in high latitudes and in shelf areas and varies between 2-7 km in regions with active eddies and in regions with strong ocean currents. The resolution of the atmospheric component (OpenIFS) is 16 km.
The simulation was carried out at the DKRZ. The visualization software used was ParaView.
Simulation: Dmitry Sein, AWI (https://www.awi.de/)
Visualization: Michael Böttinger, DKRZ (https://www.dkrz.de)