Published On Oct 11, 2012
Get the map of control theory: https://www.redbubble.com/shop/ap/550...
Download eBook on the fundamentals of control theory (in progress): https://engineeringmedia.com
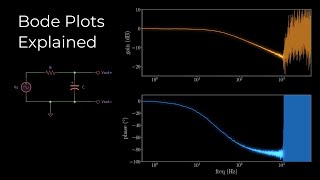
This lecture is an introduction to frequency response methods, and in particular describes the Bode plot. I go through how it is generated and why we use it to visualize the frequency response of a system across the entire frequency spectrum.
Errata:
8:31 - I should not have combined both time domain and s-domain in a single equation.
9:31 - it should be 2 - j*1/omega, I correct it at 9:55 but don't let it confuse you!
I will be loading a new video each week and welcome suggestions for new topics. Please leave a comment or question below and I will do my best to address it. Thanks for watching!
Don't forget to subscribe! Follow me on Twitter @BrianBDouglas!