Published On Jan 10, 2017
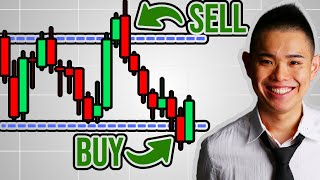
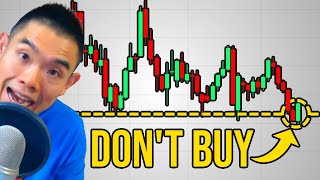
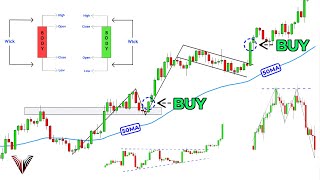
Support and Resistance Levels on Price charts help to tell you where an imbalance of supply and demand is likely to cause prices to stop and reverse.These are one of the essential tools used by professional traders.
These are essential stock trading strategies for stock traders and investors who want to improve their investment and trading performance.
Adam Khoo is a professional stocks and forex trading and the best-selling author of 'Winning the Game of Stocks" and "Profit from the Panic". Thousands of students have profited from his sharp investment insights into the world of stock investing and trading.
Helpful links
Learn about Wealth Academy live seminars at
http://bit.ly/2HGrkyJ
Learn about our Online Professional Trading Courses at
http://bit.ly/2HJwhGW
Visit Adam Khoo Learning Technologies Group at
http://bit.ly/2qFq9ri
Facebook / adamkhoosuccess