Published On Apr 5, 2015
The video above is more focused on the concept. This other one explains how it's calculated: • How to Calculate Standard Deviation
Video transcript:
"Have we discovered a new particle in physics?
Is a manufacturing process out of control?
What percentage of men are taller than Lebron James? How about taller than Yao Ming?
All of these questions can be answered using the concept of standard deviation.
For any set of data, the mean and standard deviation can be calculated. For example, five people may have the following amounts of money in their wallets: 21, 50, 62, 85, and 90. The mean is $61.60 and the standard deviation is $28.01.
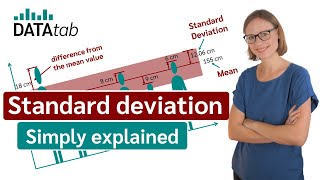
How much does the data vary from the average? Standard deviation is a measure of spread, that is, how spread out a set of data is.
A low standard deviation tells us that the data is closely clustered around the mean (or average), while a high standard deviation indicates that the data is dispersed over a wider range of values.
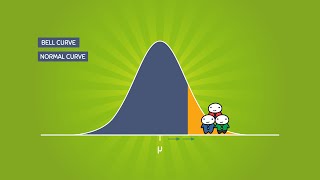
It is used when the distribution of data is approximately normal, resembling a bell curve.
Standard deviation is commonly used to understand whether a specific data point is “standard” and expected or unusual and unexpected. Standard deviation is represented by the lowercase greek letter sigma. A data point’s distance from the mean can be measured by the number of standard deviations that it is above or below the mean. A data point that is beyond a certain number of standard deviations from the mean represents an outcome that is significantly above or below the average. This can be used to determine whether a result is statistically significant or part of expected variation, such as whether a bottle with an extra ounce of soda is to be expected or warrants further investigation into the production line.
The 68-95-99.7 rule tells us that about 68% of the data fall within one standard deviation of the mean. About 95% of data fall within two standard deviations of the mean. And about 99.7% of data fall within 3 standard deviations of the mean.
The average height of an American adult male is 5’10, with a standard deviation of 3 inches. Using the 68-95-99.7 rule, this means that 68% of American men are 5’10 plus or minus 3 inches, 95% of American men are 5’10 plus or minus 6 inches, and 99.7% of American men are 5’10 plus or minus 9 inches. So, this means only about .3% of American men deviate more than 9 inches from the average, with .15% taller than 6’7 and .15% shorter than 5’1. This reasoning suggests that Lebron James is 1 in 2500 and Yao Ming is 1 in 450 million.
In particle physics, scientists have what are called 5-sigma results, results that are five standard deviations above or below the mean. A result that varies this much can signify a discovery as it has only a 1 in 3.5 million chance that it is due to random fluctuation.
In summary, standard deviation is a measure of spread. Along with the mean, the standard deviation allows us to determine whether a value is statistically significant or part of expected variation."