Published On Apr 3, 2024
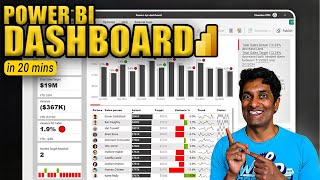
In this video, we discover the top three Power BI visualizations that are not commonly used but can greatly enhance your data analysis. From the Ribbon Chart to the Area Chart learn how to leverage these underutilized visualizations to gain deeper insights into your data. Watch this video to take your Power BI skills to the next level! Plus a bonus underutilized visual at the end!
👍 If you enjoy this video and are interested in formal training on Microsoft Teams, Power BI, Power Apps, Azure, or other Microsoft products you can visit https://prag.works/GREG40 for 40% off On-Demand Learning!
-- - - - - - - - - - - - - - - - - - - - - - - - - - - - - - - - - - - - - - - - - - - - - -- - - - - - - - - - - - - - - - - - - - - - - -
Next step on your journey:
👉 On-Demand Learning - Start With The FREE Community Plan: https://prag.works/odl-trial-yt
🔗Pragmatic Works On-Demand Learning Packages: https://pragmaticworks.com/pricing/
🔗Pragmatic Works Boot Camps: https://pragmaticworks.com/boot-camps/
🔗Pragmatic Works Hackathons: https://pragmaticworks.com/private-tr...
🔗Pragmatic Works Virtual Mentoring: https://pragmaticworks.com/virtual-me...
🔗Pragmatic Works Enterprise Private Training: https://pragmaticworks.com/private-tr...
🔗Pragmatic Works Blog: http://blog.pragmaticworks.com/
Let's connect:
✔️Twitter: / pragmaticworks
✔️Facebook: / pragmaticworks
✔️Instagram: / pragmatic.works
✔️LinkedIn: / pragmaticworks
✔️YouTube: / pragmaticworks
Pragmatic Works
7175 Hwy 17, Suite 2 Fleming Island, FL 32003
Phone: (904) 638-5743
Email: [email protected]
#pragmaticworks
00:00 Intro
00:59 Ribbon Chart
02:29 Area Chart
04:56 Sparklines
07:27 Metrics