Published On Premiered Mar 27, 2020
This video made possible with support of Brilliant - the first 200 subscribers to go to http://Brilliant.org/MinutePhysics get 20% off a Premium subscription to Brilliant.
Go to http://aatishb.com/covidtrends to explore the graph from the video yourself!
RESOURCES
Grant's 3Blue1Brown Video: Exponential Growth and Epidemics: • Exponential growth and epidemics
Aatish's Exponential/Logistic Curve-Fitting Site: https://github.com/aatishb/covid/blob...
Data Source: https://github.com/CSSEGISandData/COV...
Our World in Data Page on Coronavirus: https://ourworldindata.org/coronavirus
How many tests for COVID-19 are being performed around the world? https://ourworldindata.org/covid-testing
Understanding logarithmic scales: https://www.nytimes.com/2020/03/20/he...
What we can learn from the countries winning the coronavirus fight: https://www.abc.net.au/news/2020-03-2...
(Great explainer on log scales and growth curves explained in the context of COVID-19 in different countries)
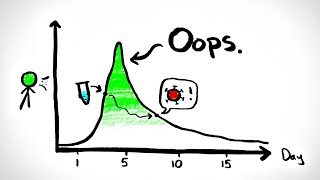
This video is a collaboration with Aatish Bhatia about how to see the COVID-19 tipping point - we present a better way to graph COVID-19 coronavirus cases using a logarithmic scale in "phase space" - plotting the growth rate against the cumulative cases, rather than either of these against time.
Support MinutePhysics on Patreon! / minutephysics
Link to Patreon Supporters: http://www.minutephysics.com/supporters/
MinutePhysics is on twitter - @minutephysics
And facebook - / minutephysics
Minute Physics provides an energetic and entertaining view of old and new problems in physics -- all in a minute!
Created by Henry Reich