Published On Apr 13, 2021
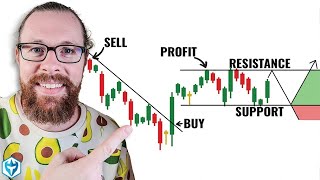
Wondering what cryptocurrencies to buy, and when? When you research crypto assets, you may run into a special type of price graph called a candlestick chart. So it’s good to take a little time to learn how these work.
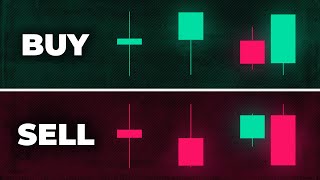
Similar to more familiar line and bar graphs, candlesticks show time across the horizontal axis, and price data on the vertical axis. But unlike simpler graphs, candlesticks have more information. In one glance, you can see the highest and lowest price that an asset hit during a given timeframe — as well as its opening and closing prices.
► Learn more about candlestick charts here: https://www.coinbase.com/learn/tips-a...
► Visit Coinbase here: https://www.coinbase.com/about
► Learn more about our mission at Coinbase here: https://www.coinbase.com/mission
✅ Subscribe to our channel here: / @coinbase
► Follow us on Twitter: / coinbase
► Like us on Facebook: / coinbase
► Find us on Instagram: / coinbase
#Coinbase #Cryptocurrency #CoinbaseWallet #CryptoExplained #DeFi #Blockchain #CoinbaseExchange #CoinbaseApp #OpenFinancialSystem #CryptoForAll #Finance #CandlestickCharts